.jpg&w=1080&q=75)
How Indian Agencies Use AI to Automate Client Monthly Reporting (2026)

How Indian Agencies Use AI to Automate Client Monthly Reporting (2026)
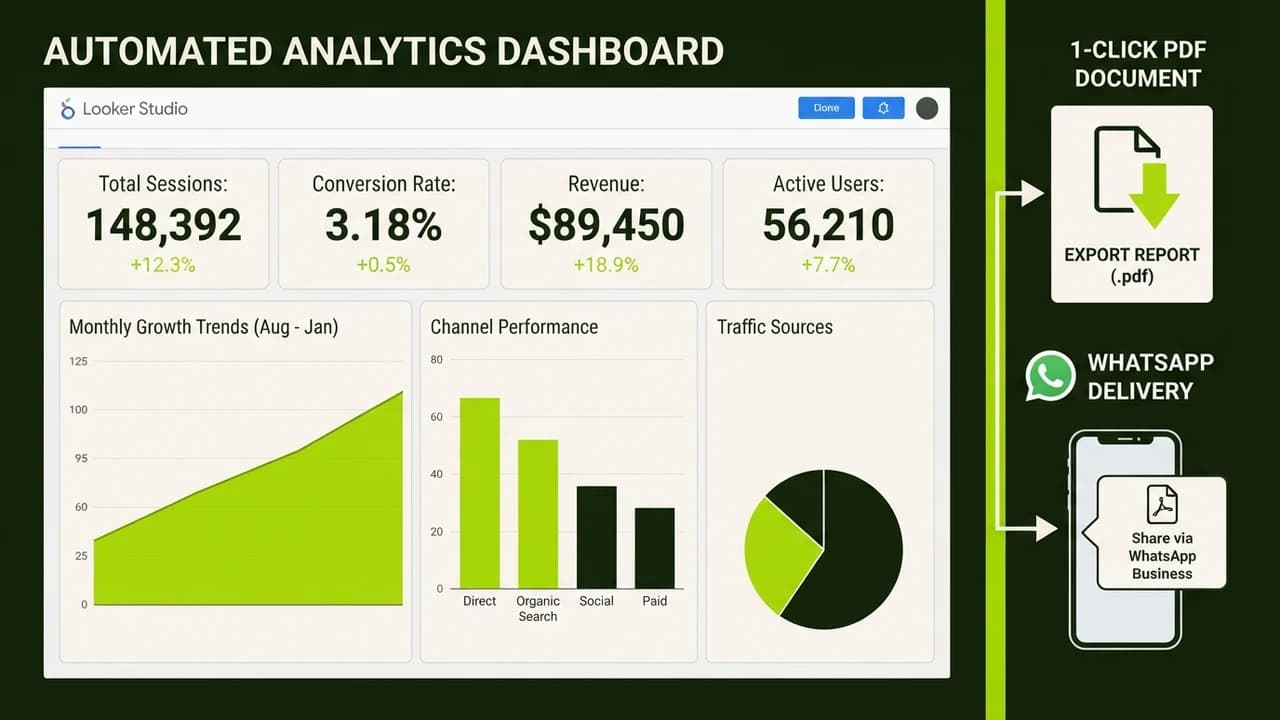
Indian digital marketing agencies use AI reporting automation by pulling advertising data from Meta and Google into Google Sheets, generating dynamic dashboards in Looker Studio, and using Claude API to draft executive summaries. This automated system transforms 30 hours of monthly manual reporting into a single-click PDF report delivered instantly via WhatsApp and email.
For digital marketing, performance marketing, and creative agency founders in India, the first five days of every month bring intense operational friction. Account managers stop focusing on campaign optimization, ad creative testing, and strategic client growth to build monthly performance decks.
When an agency manages 10 to 20 client retainers billing between ₹30,000 and ₹75,000 per month, spending 25 percent of billable employee time taking screenshots and pasting metric tables directly erodes operating profit. Automating this reporting cycle with connected AI workflows eliminates mundane slide building while providing clients with clearer, faster performance insights.
The Agency Reporting Crisis: Why Manual Monthly Slides Kill Margins
In a typical boutique Indian digital agency with 4 to 8 team members, monthly reporting follows an exhausting manual pattern:
- Data Hunting: Account managers log into Meta Ads Manager, Google Ads, and Shopify for each client account.
- Manual Adjustments: Numbers are exported to CSV files, adjusted for 18 percent GST on ad spend, and pasted into spreadsheets.
- Slide Assembly: Managers capture screenshots and paste them into 15-slide Canva decks.
- Hurried Writing: Managers draft rushed commentary like "ROAS increased due to festive promotions."
This process consumes 3 to 5 hours per client. For an agency with 15 clients, that represents 45 to 75 hours of high-cost staff time every month. Indian brand founders want three concise answers delivered directly to their WhatsApp: How much was spent, how much revenue was generated, and what is the strategic focus for next month.
The 4-Layer Architecture of an Automated AI Reporting Engine
Building a modern 1-click reporting system requires four integrated no-code layers:
- Automated Data Ingestion (Google Sheets Connectors): Connect advertising platforms to Google Sheets using connectors like Coupler.io or native script triggers. These refresh daily at midnight, recording daily ad spend in Indian Rupees (INR), impressions, clicks, cost per acquisition (CPA), and revenue into standardized sheets.
- Visual Dashboarding (Looker Studio): Google Looker Studio connects to Google Sheets and updates charts automatically. Agencies build a reusable 3-page template incorporating client brand colors and performance scorecards with zero manual formatting.
- Narrative AI Insights (Claude 3.5 Sonnet API): Graphs show what happened, but clients want to understand why. An automation webhook sends monthly summary numbers to the Claude 3.5 Sonnet API, which analyzes variances and drafts a three-paragraph executive brief covering wins, challenges, and upcoming initiatives.
- 1-Click WhatsApp and Email Delivery (Make.com or n8n): A scenario triggers on the 1st of each month. It exports the Looker Studio report as a PDF, embeds the AI summary in the message text, and sends it to the client WhatsApp group and founder inbox.
Step-by-Step Implementation Guide for Indian Agencies
Follow this four-step blueprint to deploy an automated AI reporting engine:
Step 1: Standardize Your Agency KPI Schema
Create a master Google Sheet template with tabs for Raw_Metrics and Executive_Summary. Standardize column headers across all clients: Date, Platform, Ad Spend (INR), Impressions, Clicks, CPC, Purchases, Revenue, and Blended ROAS. Uniform architecture allows duplicating workflows for new clients in under 10 minutes.
Step 2: Build a Reusable Looker Studio Client Template
Design a clean, 3-page Looker Studio dashboard:
- Page 1: Executive Scorecard: High-level KPIs (Total Spend, Total Revenue, Blended ROAS, Average CPA).
- Page 2: Channel Breakdown: Side-by-side performance of Meta Ads versus Google Ads.
- Page 3: Creative Performance: Top 5 performing ad creatives ranked by ROAS.
Set currency settings to Indian Rupees (₹) and the date control to dynamic "Last Month".
Step 3: Design the Executive Narrative Prompt for Claude API
Configure an HTTP module in Make.com sending client monthly numbers to the Anthropic API:
You are a performance marketing director at a leading Indian growth agency.
Analyze the provided advertising metrics for client "[Client Name]" comparing current month to previous month.
Data:
Total Spend: ₹3,45,000 (Meta: ₹2,10,000, Google: ₹1,35,000)
Total Revenue: ₹14,20,000 | Blended ROAS: 4.11x | Blended CPA: ₹420

Draft an executive summary in three concise sections:
1. Executive Performance Overview: Summarize revenue growth and blended return.
2. Channel Breakdown: Compare Meta scaling efficiency against Google Search intent capture.
3. Strategic Focus for Next Month: Recommend 2 specific testing initiatives for creatives and targeting.
Tone: Confident, commercial, data-grounded. Keep the entire summary under 200 words. Always use the ₹ symbol.
Step 4: Automate PDF Generation and WhatsApp Delivery
Connect the Claude API output to an HTML-to-PDF export module. Use the Meta WhatsApp Cloud API module to dispatch a personalized message to client leadership:
"Good morning Rajesh! Attached is your September 2026 marketing performance report for Apex Botanicals. Our campaigns generated ₹14.20 Lakh in revenue at a 4.11x blended ROAS, beating our target by 18 percent. Summary breakdown and full PDF report attached below."
Real Agency Case Study: How "GrowthPulse Digital" in Gurugram Reclaimed 58 Hours
GrowthPulse Digital is a 4-person performance agency in Sector 29, Gurugram, managing paid ads for 14 D2C brands with monthly retainers between ₹35,000 and ₹60,000.
The Operational Bottleneck
Co-founders Amit and Sneha faced monthly burnout. Two account managers spent 4.5 hours per client compiling reports across Meta Ads, Google Ads, and Shopify. Expending over 60 hours on manual slides neglected live campaigns, while manual math caused GST reporting errors.
The Automated Solution
GrowthPulse deployed an automated pipeline with Google Sheets, Looker Studio, Claude 3.5 Sonnet API, and Make.com:
- Daily Auto-Sync: Client metrics sync to Google Sheets nightly at 2:00 AM.
- Automated Analysis: On the 1st at 8:00 AM, Claude 3.5 reviews data and writes executive commentary.
- 1-Click Dispatch: Looker Studio reports export to PDF and reach client WhatsApp groups by 9:00 AM.
Measurable Business Results
- Time per Report: Dropped from 4.5 hours to 3 minutes of review.
- Hours Saved: 58 billable team hours reclaimed monthly.
- Operating Cost: Software expense is ₹2,400 monthly (Make.com and API credits) versus ₹15,000 monthly for enterprise SaaS.
- Client Retention: Rose from 82 percent to 95 percent with reliable 1st-of-the-month WhatsApp deliveries.
- Revenue Growth: Added 4 new clients without extra hires, adding ₹1,80,000 in monthly recurring revenue.
Manual Reporting vs. Enterprise SaaS vs. Custom AI Automation Stack
Understanding the tradeoffs between reporting workflows helps agency owners choose the optimal setup:
Operational Dimension | Manual Slide Decks | Enterprise SaaS (AgencyAnalytics/DashThis) | Custom AI Automation Stack |
|---|---|---|---|
Monthly Software Expense | ₹0 (Uses Canva / Google Slides) | ₹12,000 to ₹22,000 / month | ₹1,800 to ₹3,200 / month |
Time Invested Per Client | 3 to 5 hours monthly | 45 to 60 minutes monthly | Under 5 minutes monthly |
Executive Narrative Quality | Varies heavily with junior staff fatigue | Generic bullet templates | Highly customized, strategic Claude analysis |
Native WhatsApp Delivery | Manual WhatsApp upload | Email only; requires manual forwarding | Automated direct delivery to WhatsApp groups |
Client Currency & Indian GST | Manual currency math prone to errors | Often struggles with INR and GST adjustments | Perfectly handles INR and 18% GST rules |
Scalability Limit | Caps out at 10 to 12 clients per manager | Scales well, but gets expensive per seat | Scales infinitely with zero added headcount |
Human Error Likelihood | High (copy-paste transcription mistakes) | Low (direct API connections) | Very low (grounded spreadsheet logic) |
4 Common Pitfalls Agencies Must Avoid When Automating Reports
Avoid these four critical mistakes when designing automated client reporting systems:
1. Allowing the AI to Hallucinate Unverified Figures
Never ask an AI model to calculate revenue numbers directly from open prompts. Provide exact figures from your Google Sheet formulas and instruct the model strictly to interpret provided data.
2. Delivering Raw Metric Dumps Without Business Context
Clients do not care about technical ad jargon like impressions or CPM. Ensure your system prompt focuses on business outcomes: cost per acquisition, net revenue, and blended profitability.
3. Forgetting to Account for 18% GST on Meta Ad Invoices
Meta invoices Indian advertisers with 18 percent GST on credit card spend. If your dashboard pulls raw ad spend without GST, financial records will show discrepancies against bank statements. Ensure formulas reflect total gross ad expenditure.
4. Skipping the 60-Second Human Review Checkpoint
Maintain a rapid human checkpoint. Configure your automation to send a preview copy to your internal WhatsApp group before client delivery. A quick 60-second glance ensures that any account anomalies are addressed before the client sees the report.
Master Practical AI Systems at Zero To AI
Automating repetitive operational tasks like monthly reporting frees your agency team to focus on high-impact strategy, creative testing, and revenue growth. You do not need software developers or expensive enterprise SaaS platforms to build systems that save 50+ hours every month.
At Zero To AI, we guide Indian entrepreneurs, agency founders, and professionals through the exact frameworks needed to build scalable, automated AI revenue systems.

Learn to build AI workflows that handle your busywork — live sessions, real projects, zero code.
See the courseBeginner-friendly